Conversion Rate Optimization: The Complete Fundamentals Guide

Conversion Rate Optimization (CRO) is the systematic process of increasing the percentage of website visitors who complete desired actions. While most businesses obsess over driving more traffic, smart companies focus on converting more of the traffic they already have.
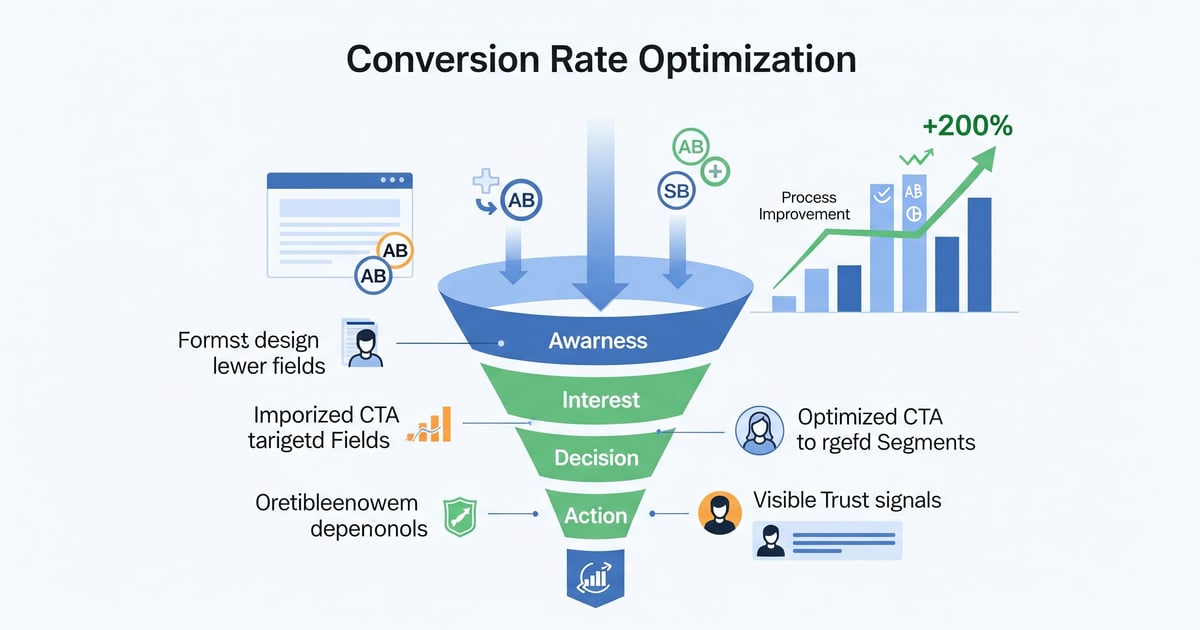
The results speak for themselves: companies that prioritize CRO see average conversion rate improvements of 200-300% within six months, effectively doubling or tripling their revenue without spending an additional dollar on traffic acquisition.
Table of Contents
Open Table of Contents
- Why CRO Matters More Than Ever in 2025
- The CRO Fundamentals Framework
- Phase 1: CRO Foundation Assessment
- Phase 2: Research and Data Collection
- Phase 3: Optimization Strategy Development
- Phase 4: Testing Implementation
- Advanced CRO Strategies
- CRO Tools and Technology Stack
- Measuring CRO Success
- CRO Case Studies
- Common CRO Pitfalls and How to Avoid Them
- Building a CRO Culture
- Your 90-Day CRO Implementation Plan
- Conclusion: CRO as a Growth Engine
Why CRO Matters More Than Ever in 2025
The Traffic Acquisition Crisis
Digital advertising costs have increased by 147% over the past five years, while organic reach on social platforms has plummeted. Meanwhile, consumer attention spans have shortened, and competition for every click has intensified.
The harsh reality: Getting more traffic is becoming exponentially more expensive and difficult.
The opportunity: Converting more of your existing traffic is becoming exponentially more valuable and achievable.
The Compound Effect of CRO
Unlike traffic acquisition, which requires ongoing investment, CRO improvements compound:
- Month 1: Improve conversion rate from 2% to 3% (+50% more sales)
- Month 3: Additional optimizations bring rate to 4% (+100% total improvement)
- Month 6: Continued testing achieves 5% rate (+150% total improvement)
- Year 1: Multiple optimizations stack to 6%+ rates (+200% total improvement)
Each improvement builds on previous gains, creating sustainable competitive advantages.
The CRO Fundamentals Framework
Understanding Conversion Psychology
Before diving into tactics, understand the psychological factors that drive conversions:
1. Motivation: Why should users act now?
- Problem urgency
- Desired outcome clarity
- Personal relevance
2. Ability: How easy is it to convert?
- Process simplicity
- Required information availability
- Technical barriers
3. Trigger: What prompts immediate action?
- Clear call-to-action
- Sense of urgency
- Social proof
The CRO Hierarchy of Impact
Focus optimization efforts where they’ll have the greatest impact:
Level 1: Fundamental Elements (Highest Impact)
- Value proposition clarity
- Primary call-to-action optimization
- Trust signal implementation
- Mobile optimization
Level 2: Supporting Elements (Medium Impact)
- Form optimization
- Page loading speed
- Navigation improvements
- Content relevance
Level 3: Advanced Elements (Lower Impact)
- Color psychology
- Button copy variations
- Image selection
- Typography choices
Phase 1: CRO Foundation Assessment
Conversion Audit Checklist
Value Proposition Analysis
- Clear primary benefit within 5 seconds
- Specific, quantifiable outcomes
- Differentiation from competitors
- Emotional connection established
Trust Signal Evaluation
- Customer testimonials with photos/names
- Security badges and certifications
- Money-back guarantee
- Contact information prominently displayed
Technical Performance Check
- Page loads under 3 seconds
- Mobile-responsive design
- Form functionality across devices
- Analytics tracking properly configured
Baseline Metric Establishment
Track these essential CRO metrics:
Primary Metrics:
- Overall conversion rate
- Revenue per visitor
- Average order value
- Customer lifetime value
Secondary Metrics:
- Bounce rate
- Time on page
- Pages per session
- Form abandonment rate
Micro-Conversion Metrics:
- Email signups
- Content downloads
- Video engagement
- Chat initiations
Phase 2: Research and Data Collection
Quantitative Research Methods
1. Analytics Deep Dive
Use Google Analytics to identify:
- Highest traffic pages with low conversions: Biggest opportunities
- High exit rate pages: User journey breakdown points
- Device and browser performance: Technical optimization needs
- Traffic source performance: Channel-specific optimization requirements
2. Heatmap Analysis
Tools like Hotjar or Crazy Egg reveal:
- Where users click (or expect to click)
- How far users scroll
- Which elements attract attention
- Where users get confused or stuck
3. User Session Recordings
Watch actual user sessions to understand:
- Navigation patterns and confusion points
- Form interaction difficulties
- Mobile usability issues
- Unexpected user behaviors
Qualitative Research Methods
1. User Surveys
Deploy exit-intent and on-page surveys asking:
- “What’s preventing you from completing your purchase today?”
- “What information would you need to feel confident buying?”
- “How would you describe our product to a friend?”
2. Customer Interviews
Conduct 15-20 minute interviews with:
- Recent customers (understand what convinced them)
- Non-customers (identify conversion barriers)
- Long-time visitors (uncover hesitation factors)
3. Usability Testing
Have real users complete tasks while thinking aloud:
- Navigate to specific products/services
- Complete the conversion process
- Find important information
- Use mobile version
Phase 3: Optimization Strategy Development
Conversion Rate Optimization Prioritization Matrix
Score potential tests on:
Impact Potential (1-10):
- Traffic volume to tested element
- Current conversion rate
- Revenue per conversion
- User experience improvement
Implementation Ease (1-10):
- Technical complexity
- Resource requirements
- Time to implement
- Risk level
Confidence Level (1-10):
- Research supporting hypothesis
- Similar test results
- User feedback strength
- Business logic
High-Impact CRO Test Ideas
1. Value Proposition Optimization
Test: Clear, benefit-focused headlines vs. feature-focused headlines
Example:
- Control: “Advanced Project Management Software”
- Variant: “Complete Projects 40% Faster With Smart Automation”
2. Social Proof Enhancement
Test: Generic testimonials vs. specific, detailed customer stories
Example:
- Control: “Great software! Highly recommended.”
- Variant: “Adaptly helped our 15-person agency reduce project delays by 60% and increase client satisfaction scores from 7.2 to 9.1 in just 3 months.” - Sarah Johnson, Creative Director, Digital Solutions Agency
3. Form Optimization
Test: Long forms vs. progressive profiling vs. social login
Strategy:
- Reduce required fields to absolute minimum
- Use smart defaults and auto-complete
- Implement social login options
- Show progress indicators for multi-step forms
4. Urgency and Scarcity Implementation
Test: Static CTAs vs. time-sensitive offers
Examples:
- “Start Free Trial” vs. “Start Your 14-Day Free Trial”
- “Get Quote” vs. “Get Your Custom Quote in 24 Hours”
Phase 4: Testing Implementation
A/B Testing Best Practices
1. Statistical Significance Requirements
- Minimum sample size: 1,000 visitors per variant
- Test duration: At least 1-2 full business cycles
- Confidence level: 95% minimum
- Statistical power: 80% minimum
2. Test Design Principles
- Single variable focus: Test one element at a time
- Clear hypothesis: “We believe that X will increase Y because Z”
- Measurable outcomes: Define success metrics upfront
- Proper randomization: Ensure unbiased traffic split
3. Common Testing Mistakes to Avoid
- Stopping tests too early
- Testing during unusual periods (holidays, promotions)
- Making multiple changes simultaneously
- Ignoring mobile vs. desktop differences
- Not considering seasonality effects
Multivariate Testing Strategy
For advanced optimization, test multiple elements simultaneously:
When to Use MVT:
- High traffic volume (10,000+ visitors/month)
- Multiple elements need optimization
- Complex interaction effects suspected
- Sufficient resources for longer tests
MVT Example:
Elements to Test:
- Headlines (3 variants)
- CTA buttons (2 variants)
- Images (2 variants)
- Trust signals (2 variants)

Total Combinations: 3 × 2 × 2 × 2 = 24 variants
Advanced CRO Strategies
1. Personalization and Segmentation
Traffic Source Optimization:
- Google Ads visitors: Emphasize immediate value and trial offers
- Organic search: Focus on education and detailed information
- Social media: Highlight social proof and community aspects
- Email traffic: Leverage existing relationship and trust
Behavioral Segmentation:
- First-time visitors: Focus on explanation and trust building
- Returning visitors: Emphasize trial offers and next steps
- High-value pages: Present premium options
- Exit-intent: Offer incentives or capture contact information
2. Mobile-First CRO
Mobile-Specific Optimizations:
- Thumb-friendly navigation: Buttons at least 44px tall
- Simplified forms: Minimize typing required
- Click-to-call buttons: Enable immediate contact
- Fast loading: Optimize for slower connections
- Vertical layout: Design for portrait orientation
3. Psychology-Driven Optimization
Cognitive Bias Applications:
Loss Aversion: Frame offers as avoiding loss
- “Don’t miss out on 50% savings” vs. “Save 50%”
Social Proof: Leverage user behavior
- “Join 10,000+ successful businesses”
- “Most popular plan” labels
Authority: Establish credibility
- Expert endorsements
- Media mentions
- Industry certifications
Reciprocity: Provide value first
- Free tools and calculators
- Educational content
- Free trials without commitment
CRO Tools and Technology Stack
Analytics and Tracking
- Google Analytics 4: Core conversion tracking
- Google Tag Manager: Event tracking implementation
- Hotjar/Crazy Egg: Heatmaps and session recordings
- Microsoft Clarity: Free heatmap alternative
A/B Testing Platforms
- Google Optimize: Free testing for basic needs
- Optimizely: Enterprise-level testing and personalization
- VWO: Comprehensive CRO platform
- Unbounce: Landing page focused testing
Survey and Feedback Tools
- Hotjar Surveys: On-site feedback collection
- Typeform: Engaging survey design
- Qualaroo: Targeted user research
- UserVoice: Customer feedback management
Specialized CRO Tools
- Adaptly: AI-powered landing page personalization
- Dynamic Yield: Enterprise personalization platform
- Monetate: E-commerce optimization
- Convert: GDPR-compliant testing platform
Measuring CRO Success
Key Performance Indicators
Primary KPIs:
- Conversion rate: Percentage of visitors completing goals
- Revenue per visitor: Total revenue divided by total visitors
- Customer acquisition cost: Total marketing spend per new customer
- Return on ad spend: Revenue generated per dollar spent
Supporting Metrics:
- Micro-conversion rates: Email signups, content downloads
- Average order value: Revenue per transaction
- Customer lifetime value: Long-term customer worth
- Time to conversion: How long customers take to decide
ROI Calculation Framework
CRO Investment Calculation:
Monthly CRO Investment:
- Tool costs: $500
- Agency/contractor fees: $5,000
- Internal time: $2,000
Total Monthly Investment: $7,500
CRO Return Calculation:
Before CRO:
- Monthly visitors: 10,000
- Conversion rate: 2%
- Conversions: 200
- Revenue per conversion: $1,000
- Monthly revenue: $200,000

After CRO (6 months):
- Monthly visitors: 10,000 (same traffic)
- Conversion rate: 5%
- Conversions: 500
- Revenue per conversion: $1,000
- Monthly revenue: $500,000

Additional monthly revenue: $300,000
Annual additional revenue: $3,600,000
CRO annual investment: $90,000
ROI: 4,000%
CRO Case Studies
Case Study 1: SaaS Company 347% Improvement
Challenge: B2B software company with 1.2% trial signup rate
Optimization Strategy:
- Value proposition clarity: Changed from feature-focused to outcome-focused messaging
- Social proof enhancement: Added specific customer success metrics
- Form simplification: Reduced signup fields from 8 to 3
- Mobile optimization: Redesigned entire mobile experience
Results After 4 Months:
- Trial signup rate: 5.4% (+347%)
- Qualified leads: +312%
- Customer acquisition cost: -45%
- Revenue per visitor: +289%
Key Learnings: Mobile optimization had the biggest single impact, improving conversions by 156% alone.
Case Study 2: E-commerce 278% Revenue Increase
Challenge: Online retailer with 0.9% purchase conversion rate
Testing Program:
- Product page optimization: Enhanced images and descriptions
- Checkout process streamlining: Reduced steps from 5 to 2
- Trust signal implementation: Added security badges and guarantees
- Abandoned cart recovery: Email sequence with incentives
Results After 6 Months:
- Purchase conversion rate: 3.4% (+278%)
- Average order value: +23%
- Cart abandonment rate: -41%
- Customer lifetime value: +156%
Common CRO Pitfalls and How to Avoid Them
Pitfall 1: Testing Too Many Variables Simultaneously
Problem: Can’t determine which changes drove results Solution: Test one primary element at a time, document all changes
Pitfall 2: Stopping Tests Too Early
Problem: False positives due to insufficient data Solution: Always reach statistical significance, typically 1-2 weeks minimum
Pitfall 3: Ignoring Mobile Experience
Problem: Mobile often represents 60%+ of traffic Solution: Design mobile-first, test mobile-specific variants
Pitfall 4: Focusing Only on Primary Conversions
Problem: Missing micro-conversion optimization opportunities Solution: Optimize entire funnel, not just final conversion step
Building a CRO Culture
Organizational CRO Implementation
1. Executive Buy-in
- Present CRO ROI potential to leadership
- Start with high-impact, quick-win tests
- Share results and success stories regularly
2. Cross-Functional Collaboration
- Marketing: Provides traffic and campaign insights
- Design: Creates test variations and user experiences
- Development: Implements tests and tracking
- Analytics: Measures and reports results
3. Continuous Learning Framework
- Document all test results (wins and losses)
- Share insights across teams
- Build testing calendar and roadmap
- Celebrate optimization successes
Your 90-Day CRO Implementation Plan
Days 1-30: Foundation and Research
- Implement comprehensive analytics tracking
- Conduct conversion audit and baseline measurement
- Deploy heatmap and user recording tools
- Complete initial user research (surveys, interviews)
- Identify top 5 optimization opportunities
Days 31-60: First Wave Testing
- Launch 2-3 high-impact A/B tests
- Implement quick-win optimizations (mobile fixes, form improvements)
- Begin collecting user feedback data
- Set up testing calendar and process
Days 61-90: Optimization and Scaling
- Analyze first test results and implement winners
- Launch second wave of tests based on learnings
- Develop personalization strategy
- Plan advanced optimization initiatives
Conclusion: CRO as a Growth Engine
Conversion Rate Optimization isn’t just about incremental improvements—it’s about transforming your entire business growth trajectory. While competitors fight over expensive traffic, CRO leaders create sustainable advantages by converting more of every visitor.
The companies that master CRO will dominate their markets because they can:
- Outbid competitors for traffic (higher conversion value)
- Achieve profitable growth at any scale
- Reinvest savings into additional marketing channels
- Build better user experiences that create customer loyalty
CRO is both an art and a science, requiring creativity, analytical thinking, and systematic execution. But for businesses willing to embrace data-driven optimization, the rewards are transformational.
Ready to see how AI can accelerate your CRO efforts? Discover how Adaptly uses machine learning to automatically optimize landing page conversions across all your traffic sources.