A/B Testing Landing Pages: The Complete 2025 Guide

A/B testing landing pages is the most reliable path to dramatically higher conversion rates, yet 90% of businesses do it wrong. They run tests that are too short, test too many variables simultaneously, or make decisions based on insufficient data—ultimately wasting time and leaving money on the table.
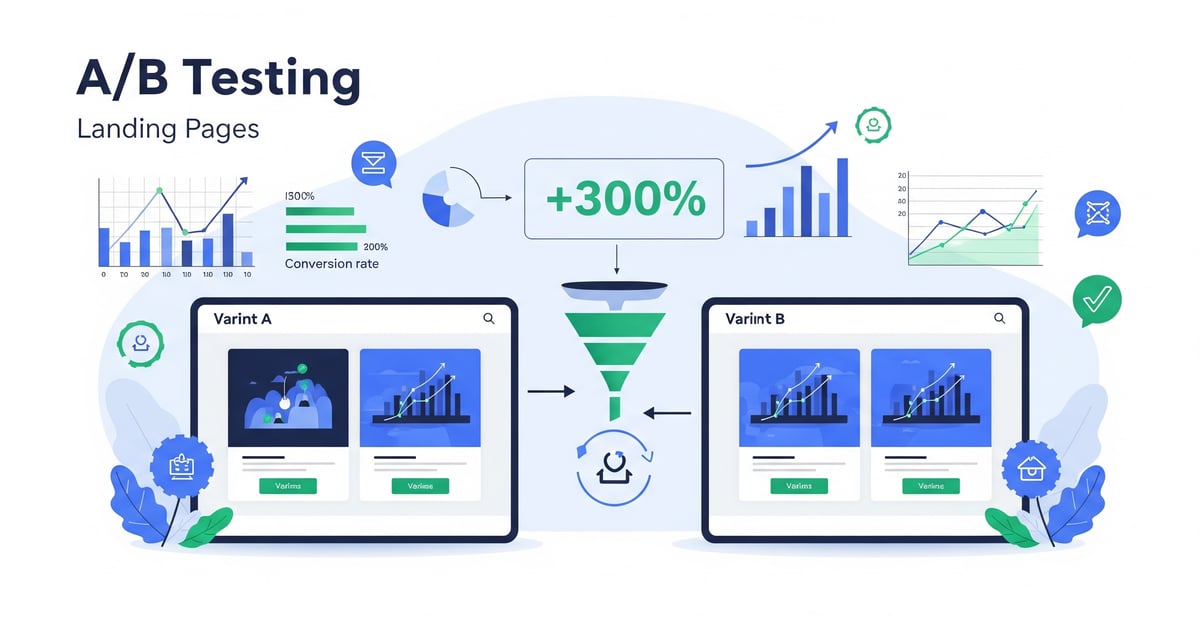
Companies that master systematic A/B testing see average conversion improvements of 300-500% within their first year. But success requires more than changing button colors and hoping for the best. It demands rigorous methodology, statistical understanding, and strategic test planning.
Table of Contents
Open Table of Contents
- The Science Behind Landing Page A/B Testing
- A/B Testing Framework for Landing Pages
- High-Impact Landing Page Test Ideas
- Advanced A/B Testing Strategies
- Statistical Analysis and Decision Making
- A/B Testing Tools and Platforms
- A/B Testing Case Studies
- Building an A/B Testing Culture
- Your A/B Testing Implementation Roadmap
- Conclusion: The Compound Power of A/B Testing
The Science Behind Landing Page A/B Testing
Why A/B Testing Works
A/B testing removes guesswork from optimization by providing statistical proof of what actually drives conversions. Instead of relying on best practices that may not apply to your specific audience and context, you discover what works for your unique situation.
The Power of Incremental Improvements:
- Month 1: 15% conversion improvement
- Month 3: +22% additional improvement (compounding to 40% total)
- Month 6: +18% additional improvement (compounding to 67% total)
- Month 12: +35% additional improvement (compounding to 125% total)
Each winning test builds on previous gains, creating exponential growth in conversion performance.
Statistical Significance Fundamentals
Key Statistical Concepts:
Confidence Level: How certain you are that results aren’t due to chance
- 95% confidence: 5% chance results are due to random variation
- 99% confidence: 1% chance results are due to random variation
Statistical Power: Ability to detect true differences when they exist
- 80% power: Standard minimum for reliable results
- 90% power: Higher confidence in detecting smaller improvements
Sample Size Requirements:
Minimum reliable sample size calculation:
- Current conversion rate: 3%
- Minimum detectable effect: 20% relative improvement
- Confidence level: 95%
- Statistical power: 80%
Required sample size: ~4,000 visitors per variant
A/B Testing Framework for Landing Pages
Phase 1: Test Planning and Hypothesis Development
1. Conversion Funnel Analysis
Identify the biggest conversion bottlenecks:
- Traffic analysis: Where do most visitors come from?
- Behavior flow: Where do users drop off most frequently?
- Device breakdown: Mobile vs. desktop performance differences
- Page element analysis: Which sections get the most attention?
2. Hypothesis Formation
Create testable hypotheses using this framework: “We believe that [change] will [outcome] because [reasoning]”
Example: “We believe that changing our headline from ‘Project Management Software’ to ‘Complete Projects 40% Faster’ will increase trial signups by 25% because it focuses on specific outcomes rather than generic features.”
3. Test Prioritization Matrix
Score potential tests on:
- Impact potential (1-10): How much could this improve conversions?
- Implementation ease (1-10): How simple is it to build and deploy?
- Learning value (1-10): How much will this teach us about our audience?
Phase 2: Test Design and Setup
Single Variable Testing (Recommended)
Test one primary element at a time to clearly understand what drives results:
High-Impact Elements to Test:
- Headlines: Primary value proposition
- Call-to-action buttons: Copy, color, size, placement
- Images: Hero images, product shots, people
- Forms: Field quantity, layout, copy
- Social proof: Testimonials, logos, reviews
- Value propositions: Benefits vs. features focus
Multivariate Testing (Advanced)
Test multiple elements simultaneously when:
- High traffic volume (10,000+ monthly visitors)
- Sufficient resources for longer test duration
- Suspected interaction effects between elements
Example MVT Setup:
Elements to test:
- Headlines (3 variants)
- CTA buttons (2 variants)
- Images (2 variants)
Total combinations: 3 × 2 × 2 = 12 variants
Required traffic: ~48,000 visitors for reliable results
Phase 3: Test Implementation
Technical Setup Requirements
1. Testing Platform Configuration
- Google Optimize: Free option for basic testing
- Optimizely: Enterprise-level testing capabilities
- VWO: Comprehensive CRO platform
- Unbounce: Landing page focused testing
2. Proper Traffic Allocation
- 50/50 split: Standard for simple A/B tests
- Equal random assignment: Ensure unbiased distribution
- Consistent user experience: Same user sees same variant across sessions
3. Goal Tracking Setup
- Primary conversion: Main business objective
- Secondary conversions: Micro-conversions and engagement metrics
- Revenue tracking: For e-commerce and high-value conversions
High-Impact Landing Page Test Ideas
1. Headline Optimization Tests
Test Type: Value Proposition Clarity
Control: “Advanced Project Management Platform” Variant A: “Complete Projects 40% Faster with Smart Automation” Variant B: “Finally, Project Management That Actually Works”
Why This Works: Specific benefits outperform generic features
2. Call-to-Action Optimization
Test Type: CTA Button Copy
Control: “Submit” Variant A: “Get My Free Trial” Variant B: “Start Boosting Productivity Today”
Test Type: CTA Button Design
Control: Blue button, standard size Variant A: Orange button (high contrast), 20% larger Variant B: Green button with arrow icon
3. Social Proof Enhancement
Test Type: Testimonial Format
Control: “Great software! - John D.” Variant A: “Adaptly reduced our project delays by 60% and saved us 15 hours per week. Best investment we’ve made.” - John Davidson, Operations Director, TechFlow Solutions Variant B: Video testimonial with customer explaining specific results
4. Form Optimization Tests
Test Type: Form Length
Control: 8-field form (name, email, company, phone, industry, team size, budget, timeline) Variant A: 3-field form (name, email, company) Variant B: Progressive profiling (3 fields initially, request more after signup)
Test Type: Form Layout
Control: Vertical form layout Variant A: Horizontal form layout Variant B: Multi-step form with progress indicator
5. Visual Element Testing
Test Type: Hero Image Impact
Control: Product screenshot Variant A: Happy customers using product Variant B: Before/after results visualization
Test Type: Page Layout
Control: Traditional long-form landing page Variant A: Above-the-fold focused design Variant B: Interactive elements and animations
Advanced A/B Testing Strategies
1. Audience Segmentation Testing
Demographic-Based Testing:
- Test different headlines for different age groups
- Adjust social proof for industry segments
- Customize offers based on company size
Behavioral Segmentation:
- First-time visitors: Focus on education and trust
- Returning visitors: Emphasize trial offers and urgency
- High-intent traffic: Present premium options
Example:
Segment: First-time visitors from Google Ads
Control: "Project Management Software"
Test: "New to Project Management? Start Here."

Segment: Returning visitors
Control: "Project Management Software"
Test: "Welcome Back! Ready to Start Your Free Trial?"
2. Sequential Testing Strategy
Test Building Approach:
- Test 1: Optimize primary headline
- Test 2: Optimize CTA button (using winning headline)
- Test 3: Optimize social proof (using previous winners)
- Test 4: Optimize form design (using all previous winners)
This approach compounds improvements systematically.
3. Device-Specific Optimization
Mobile vs. Desktop Testing:
- Mobile-specific tests: Touch-friendly buttons, simplified forms
- Desktop-specific tests: Detailed information, larger forms
- Cross-device journey: Consistent experience optimization
Statistical Analysis and Decision Making
Interpreting Test Results
Key Metrics to Monitor:
- Conversion rate: Primary success metric
- Statistical significance: Confidence in results
- Practical significance: Meaningful business impact
- Secondary metrics: Engagement, revenue per visitor
Sample Size Calculation: Use online calculators or this formula:
n = (Zα/2 + Zβ)² × (p1(1-p1) + p2(1-p2)) / (p1-p2)²

Where:
n = sample size per group
Zα/2 = critical value for confidence level
Zβ = critical value for statistical power
p1 = control conversion rate
p2 = expected test conversion rate
Common Statistical Mistakes
1. Peeking at Results Too Early Problem: Stopping tests when results look good Solution: Pre-determine sample size and test duration
2. Ignoring Statistical Power Problem: Tests lack ability to detect true differences Solution: Calculate required sample sizes before starting
3. Multiple Comparison Errors Problem: Testing many variants increases false positive risk Solution: Adjust significance levels or use sequential testing
4. Confusing Statistical and Practical Significance Problem: Implementing statistically significant but tiny improvements Solution: Set minimum meaningful effect sizes upfront
A/B Testing Tools and Platforms
Free Testing Tools
Google Optimize
- Pros: Free, integrates with Google Analytics
- Cons: Limited features, being discontinued in 2023
- Best for: Small businesses, basic testing needs
Google Analytics Experiments
- Pros: Built into GA4, easy setup
- Cons: Basic functionality, limited targeting
- Best for: Simple redirect tests
Professional Testing Platforms
Optimizely
- Pros: Advanced features, enterprise-level capabilities
- Cons: Expensive, complex setup
- Best for: Large businesses, complex testing needs
VWO (Visual Website Optimizer)
- Pros: User-friendly interface, comprehensive features
- Cons: Can be slow, pricing tiers
- Best for: Mid-market businesses, regular testing
Unbounce
- Pros: Landing page focused, built-in testing
- Cons: Limited to Unbounce pages
- Best for: Landing page optimization specialists
Specialized Tools
Convert
- Pros: GDPR compliant, statistical rigor
- Cons: Learning curve, technical setup
- Best for: Businesses requiring data privacy compliance
AB Tasty
- Pros: European alternative, personalization features
- Cons: Limited market presence
- Best for: European businesses, personalization focus
A/B Testing Case Studies
Case Study 1: SaaS Company 312% Conversion Improvement
Challenge: B2B software company with 1.8% trial conversion rate
Testing Program:
-
Test 1 - Headlines: Feature-focused vs. benefit-focused
- Winner: Benefit-focused (+47% improvement)
-
Test 2 - Social Proof: Generic testimonials vs. specific results
- Winner: Specific results (+31% additional improvement)
-
Test 3 - Form Design: 7 fields vs. 3 fields
- Winner: 3 fields (+22% additional improvement)
-
Test 4 - CTA Copy: “Start Trial” vs. “Get Instant Access”
- Winner: “Get Instant Access” (+18% additional improvement)
Cumulative Results:
- Total improvement: 312% (1.8% to 7.4% conversion rate)
- Revenue impact: $2.1M additional annual revenue
- Test duration: 8 months, 16 total tests
Case Study 2: E-commerce Brand 267% Revenue Increase
Challenge: Online retailer with 0.9% purchase conversion rate
Optimization Approach:
- Product page headlines: Generic vs. benefit-specific
- Checkout process: 5-step vs. 2-step checkout
- Trust signals: Basic security badges vs. comprehensive trust elements
- Mobile optimization: Separate mobile-specific tests
Results After 6 Months:
- Purchase conversion rate: 3.3% (+267%)
- Average order value: +34%
- Mobile conversion rate: +421%
- Customer lifetime value: +89%
Building an A/B Testing Culture
Organizational Implementation
1. Leadership Buy-in
- Present A/B testing ROI potential
- Start with high-impact, quick-win tests
- Share results and celebrate successes
2. Team Training
- Statistical significance education
- Hypothesis development workshops
- Tool training and best practices
3. Testing Calendar Development
- Plan tests quarterly
- Avoid testing during unusual periods
- Coordinate with marketing campaigns
Process Documentation
Standard Operating Procedure:
- Hypothesis development: Clear, testable predictions
- Test design: Single variable focus
- Implementation: Proper technical setup
- Monitoring: Daily result checks without decision-making
- Analysis: Statistical and practical significance evaluation
- Implementation: Winner deployment and documentation
Your A/B Testing Implementation Roadmap
Month 1: Foundation Setup
- Choose and implement testing platform
- Set up proper analytics tracking
- Conduct conversion audit to identify opportunities
- Train team on testing methodology
Month 2: First Tests
- Launch 2-3 high-impact tests
- Focus on headlines and CTA optimization
- Establish testing documentation process
- Begin building testing calendar
Month 3: Scaling and Optimization
- Analyze first test results
- Implement winning variations
- Launch second wave of tests
- Develop advanced testing strategies
Conclusion: The Compound Power of A/B Testing
A/B testing landing pages isn’t just about individual test wins—it’s about building a systematic approach to continuous improvement that compounds over time. Each successful test provides not only immediate conversion gains but also valuable insights about your audience that inform future optimization efforts.
The businesses that consistently outperform competitors are those that treat A/B testing as a core competency, not an occasional activity. They understand that systematic testing, proper statistical methodology, and continuous learning create sustainable competitive advantages that are difficult to replicate.
The question isn’t whether A/B testing works—it’s whether you’ll commit to doing it systematically and scientifically. The companies that do will dominate their markets through superior conversion performance.
Related Resources:
- Learn about AI-Powered Website Personalization as a complement to A/B testing
- Master PPC Message Match Strategies to improve your testing effectiveness
- Explore Conversion Rate Optimization Fundamentals for comprehensive optimization strategies
Ready to accelerate your A/B testing with AI-powered optimization? Discover how Adaptly automatically tests and optimizes landing page variations to maximize conversions across all your traffic sources.